Using clustering to design citywide grocery delivery
How k-means clustering turns customer locations into delivery territories, store partnerships, and route-friendly hubs—and how the elbow method helps you choose k.
- Data Science
- Clustering
- Operations
Clustering answers a practical question: which things belong together? Unlike supervised models that predict a label you already know, clustering discovers structure in unlabeled data. In city operations, that structure is often geographic—customers, stores, and delivery windows that form natural neighborhoods once you stop treating every address as an isolated point.
A grocery delivery business is a clean example. Orders land across dozens of ZIP codes. Partner stores sit in different parts of the city. Same-day SLAs punish long cross-town hops. The goal is not one warehouse that serves everyone equally poorly. It is a small set of hubs—existing grocery partners or micro-fulfillment points—each responsible for a coherent territory so the average trip stays short.
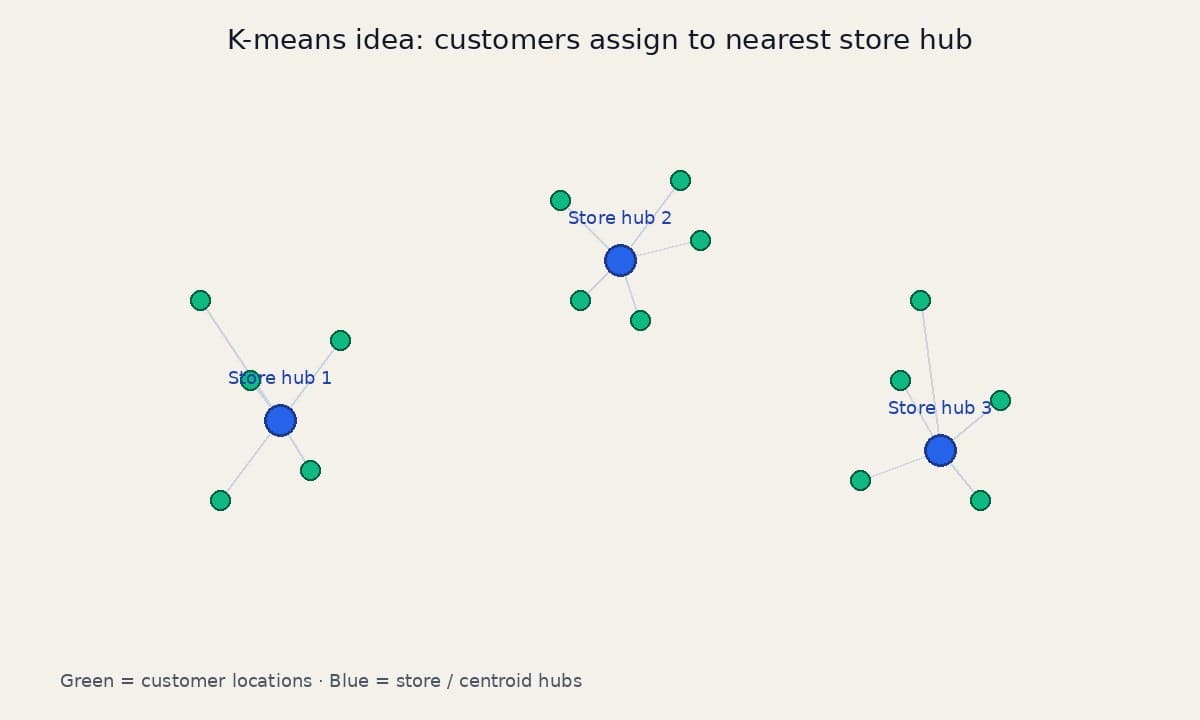
K-means is a strong first tool for that problem. You choose k, the number of hubs. The algorithm then partitions customers into k groups and places a centroid in each group. Those centroids become candidate store partnerships or distribution hubs. The same partition also guides routing: once a multi-stop run is confined to one cluster, the driver is no longer zigzagging across unrelated neighborhoods.
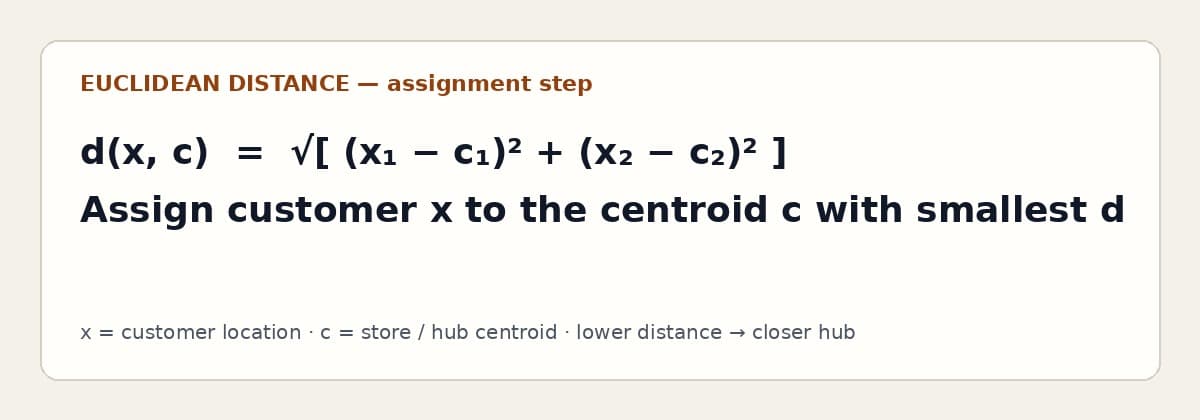
Start with a map of enrolled customers as green points and candidate stores as blue points. In the first pass, the blue points—or any reasonable seed locations—act as centroids. Each customer is assigned to the nearest centroid using Euclidean distance in a projected coordinate space (or a city-appropriate distance if you have road data). That assignment step is the heart of the algorithm: membership follows proximity.
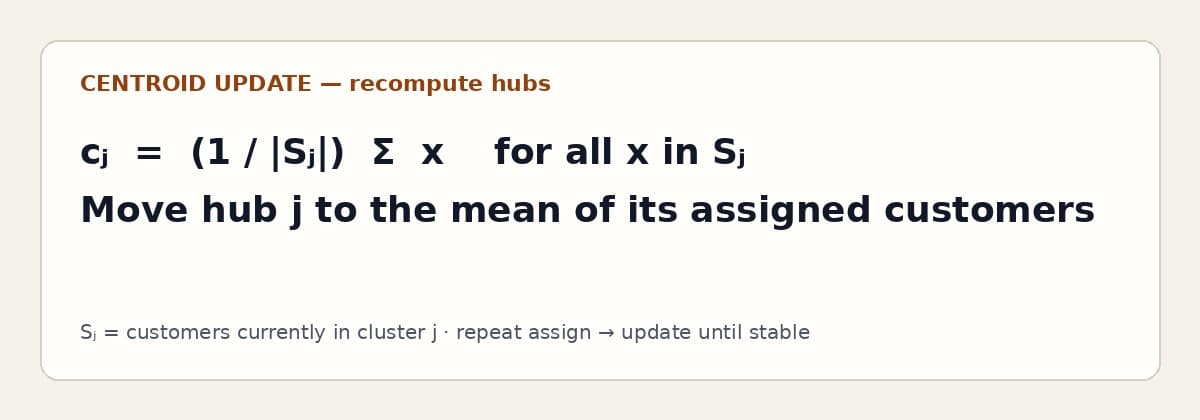
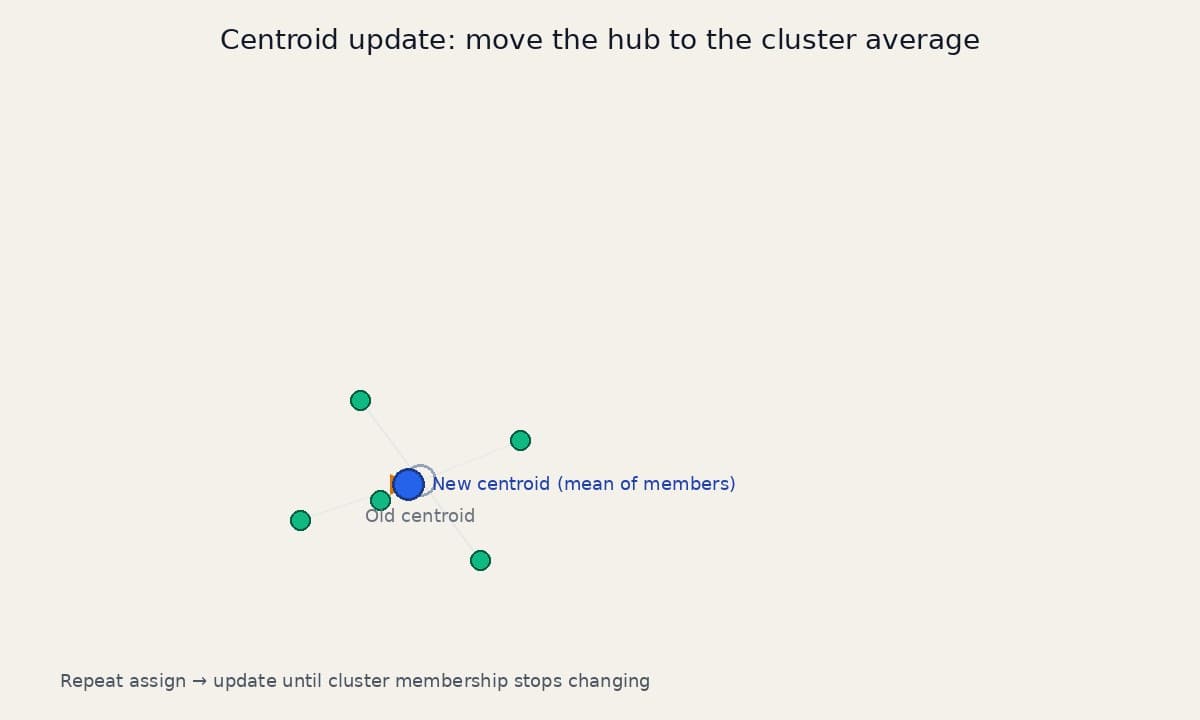
After every customer has a cluster, recompute each centroid as the average position of its members. The hub “slides” toward the densest part of its territory. Then repeat: re-assign customers to the updated hubs, then recompute averages again. Stop when membership stops changing—or when centroid movement falls below a small threshold. The final centroids are actionable: they are the places where a partner store, dark store, or cross-dock creates the most geographic leverage.
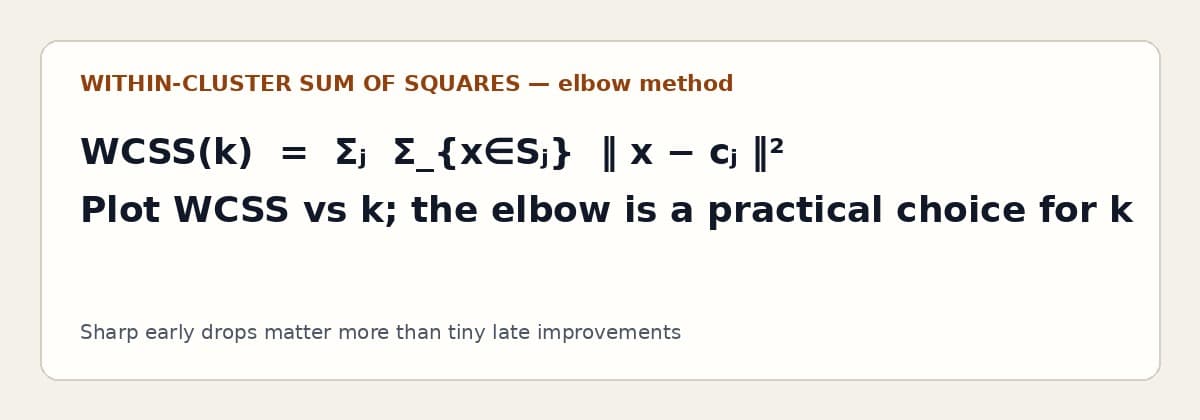
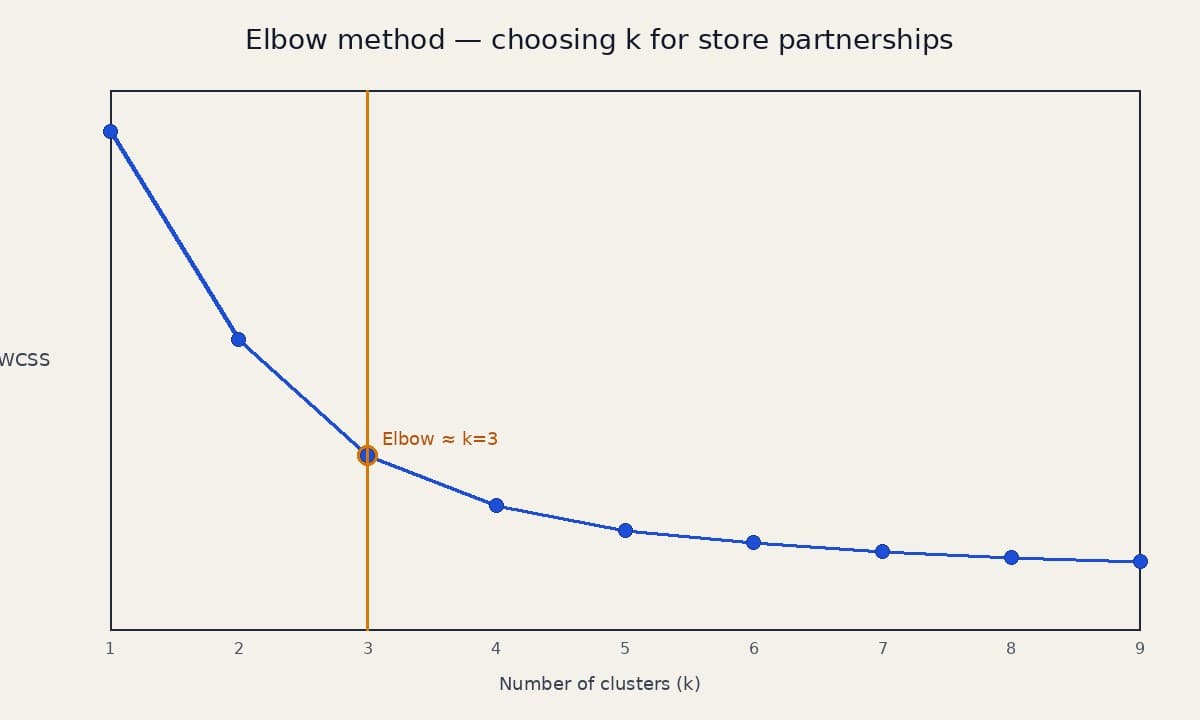
What about k itself? Too few hubs and territories stay oversized; drivers burn time. Too many hubs and partnership cost, inventory complexity, and thin volume per store erode the model. The elbow method helps. Plot within-cluster sum of squares (how far customers sit from their hub) against k. Early increases in k cut that error sharply. Later increases buy little. The “elbow”—where the curve flattens—is a practical starting value for how many store partnerships to pursue.
In production you refine beyond textbook k-means. Weight customers by order frequency or basket value so high-volume blocks pull hubs harder. Cap cluster radius to honor delivery-time promises. Re-run weekly as the customer map shifts. And treat ZIP codes as a feature or stratification layer, not the whole model—ZIP boundaries are administrative; travel time is operational.
The same pattern shows up outside grocery: provider panels by geography, claims audit sampling by peer groups, or warehouse catchment design. Clustering does not invent strategy. It makes the latent geography visible so partnership and routing decisions stop being gut feel drawn on a whiteboard.