Descriptive vs inferential statistics—and when a QQ plot helps
Descriptive statistics summarize the data you have. Inferential statistics carefully extend a sample toward a population. Mixing them up is how dashboards overclaim.
- Statistics
- Data Science
- Analytics
Every data review eventually makes a claim. Some claims only describe the rows on the screen. Others quietly imply something about a larger world. Descriptive and inferential statistics exist to keep that difference visible.
Descriptive statistics summarize and present the dataset you actually measured. Common tools are measures of central tendency—mean, median, and mode—measures of dispersion such as range, variance, and standard deviation, plus frequency tables and charts. The goal is clarity: where is the center, how wide is the spread, and what shape shows up when you plot it.
Inferential statistics go further. They use a sample to support careful statements about a larger population—through hypothesis tests, confidence intervals, and regression. The leap is powerful and easy to abuse. It requires sampling assumptions, an explicit population, and enough humility to separate estimate from certainty.
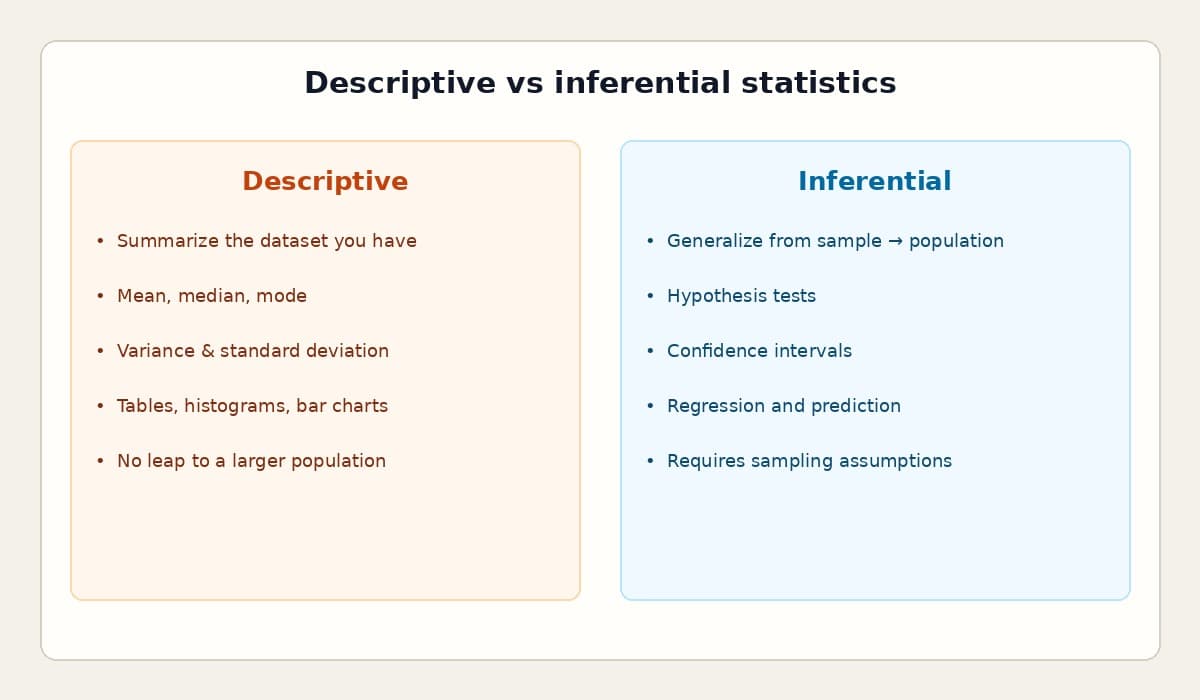
A concrete example helps. Suppose you summarize commute modes for employees at one office campus: mean commute time, the most common mode, the spread across teams. That is descriptive work. It does not automatically describe every employer in the city or region. Inferential methods—with a sampling design and stated assumptions—are what let you argue from a sample toward a wider population. In business meetings, that boundary gets blurred whenever a slide titled “what we see” is heard as “what is true everywhere.”
Descriptive statistics still earn their keep as the foundation. The mean is sensitive to extremes; the median is often more honest for skewed operational data; the mode surfaces the most common category. Dispersion tells you whether a “typical” value is representative or a coincidence. Range is simple but brittle. Variance averages squared distance from the mean; standard deviation brings that spread back into the original units so people can interpret it. Frequency tables, histograms, and bar charts make the distribution visible so you are not negotiating with a single headline number.
Inferential work starts only after that picture is clear. Hypothesis tests ask whether an observed difference is compatible with chance under a model. Confidence intervals communicate range, not just a point. Regression relates predictors to outcomes and forces you to confront confounding and fit. None of these tools forgive a convenience sample pretending to be a census.
A QQ (quantile–quantile) plot is one of the most practical visual checks before you lean on distributional assumptions. Quantiles split a distribution into equal-probability parts—quartiles into four, percentiles into a hundred. A QQ plot graphs sample quantiles against theoretical quantiles from a reference distribution, often the normal. If the points roughly follow the diagonal, the sample is compatible with that distribution. Points need not sit exactly on the line; random scatter above and below is expected. A useful heuristic is the fat-pencil test: if a thick pencil covering the reference line also covers the points, the match is plausible. Systematic curves or bends suggest skew, heavy tails, or another family such as lognormal or exponential.
Why does this matter in production analytics? Because payment-integrity, claims, and operational reviews are full of samples that look complete. A week of claims is not the year. One provider peer group is not the network. Descriptive summaries keep teams honest about what the extract contains. Inferential methods—and assumption checks like QQ plots—are what justify statements that reach beyond the extract. Label the claim either way, and the room makes better decisions.