Sampling variability: why two samples from the same population disagree
Sampling variability is the natural gap between statistics from different random samples of the same population. The standard error measures how far a sample mean can wobble, and the law of large numbers is why that wobble shrinks as the sample grows.
- Statistics
- Data Science
- Sampling
Sampling variability is the natural difference between statistics computed from different random samples of the same population. Draw two honest samples. Compute the same mean. The numbers will not match. The arithmetic can be perfect and the gap will still be there. That gap is sampling variability.
Sleep in a city makes the idea concrete. Interviewing everyone is impractical, so you take a smaller group and ask about last night. Draw a second group at random from the same city and the average sleep time moves. The question did not change. The people did. Each sample is a subset, a snapshot, and two snapshots frame different faces. The mean, the median, and the standard deviation move with whoever was drawn. A sample result is an estimate with a built-in wobble, not a final statement about the whole group.
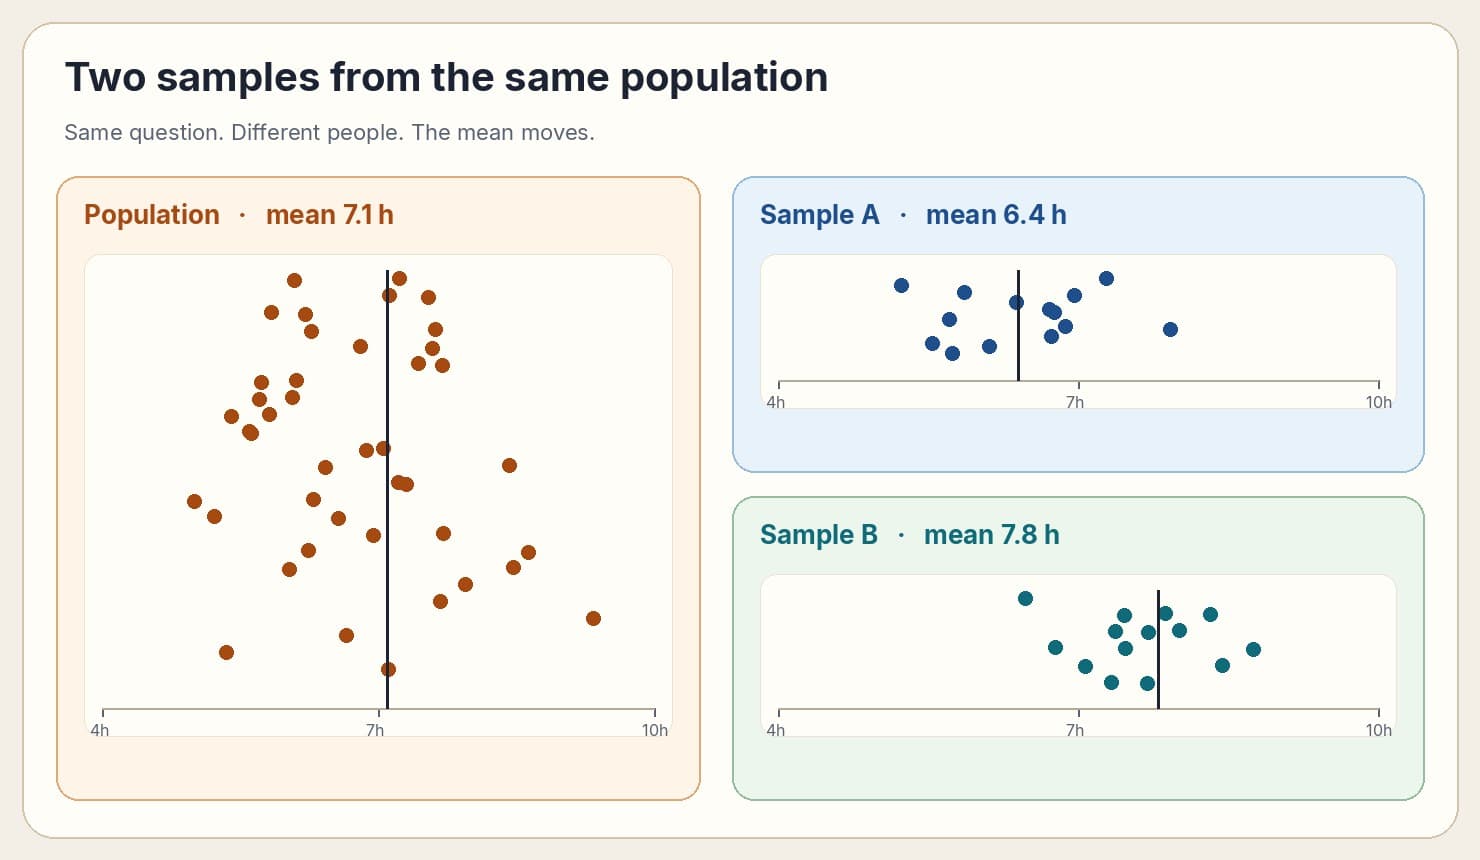
How wide that wobble is depends first on sample size. A larger sample usually lands closer to the population value because it covers more of the group. A handful of unusual people cannot swing it as easily. A small sample is at the mercy of whoever happened to be included. Ten night-shift workers can make a city look sleepless. A few hundred people, drawn the same way, are much harder to tip.
The second driver is how mixed the population is. A diverse city—wide age ranges, day jobs, call centers, night work—puts very different people into each draw, so the sample means jump around more. A narrower group moves less from sample to sample. Same sample size, more heterogeneity, more sampling variability. Size and diversity are doing different jobs. A mixed population stays mixed no matter how carefully you randomize the next draw.
The standard error of the mean is how you measure that wobble for averages. The standard deviation describes the people inside one sample: how far individual sleep times sit from one another. The standard error answers a different question. If you repeated the sample many times, how far would those sample averages sit from the true average of the city? A smaller standard error means the average in front of you is a sharper estimate of the population average.
For a simple random sample, the standard error of the mean is the sample standard deviation divided by the square root of the sample size. Two levers sit in that formula. A more mixed population, a larger standard deviation, widens the error. A larger sample shrinks it, and the shrink follows the square root, not a straight line. Quadrupling the sample cuts the standard error roughly in half. Going from 30 people to 40 does less than a project plan usually hopes.
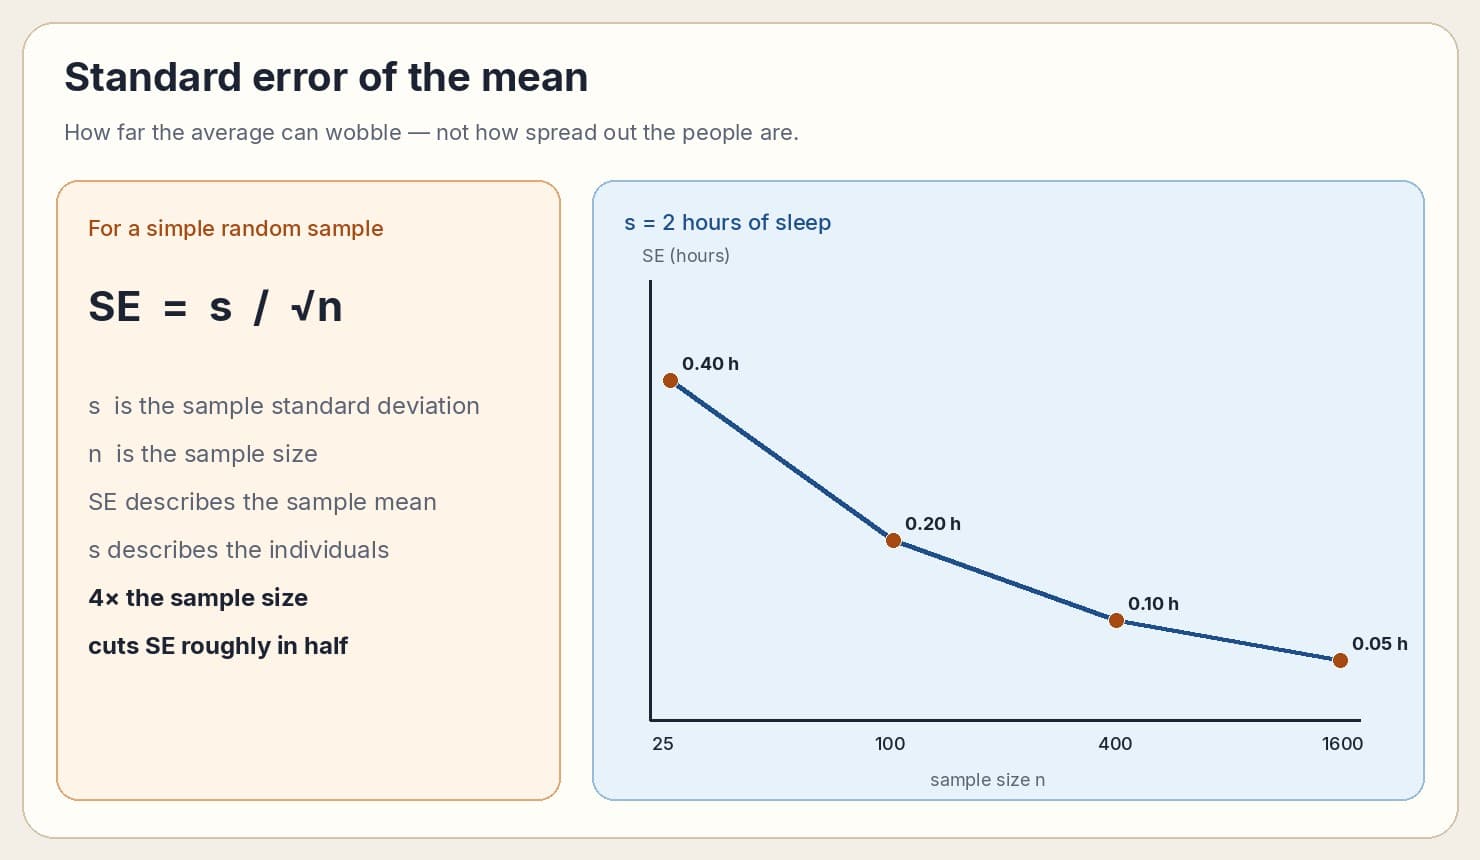
A small standard error is a reason to trust the sample average as a stand-in for the population average. A large one is a reason to slow down. The average can still be your best guess. The standard error is the wiggle room around that guess, the part that exists because you only saw a piece of the group. Publish the average alone and the snapshot is being asked to stand in for the city.
The law of large numbers is why the wiggle room shrinks at all. Repeat a random experiment independently, many times, and the average of what you observe moves toward the expected value. A fair coin has a probability of heads of one half. Ten flips can land far from that. Thousands of flips usually do not. The proportion of heads settles toward one half because the odd runs get diluted. Any single flip stays just as random.
That principle is the permission slip for using a sample statistic as an estimate of a population parameter. Take a large enough random sample and the sample mean is a reliable estimate of the population mean. Surveys, polls, and a lot of industrial measurement rest on that permission. Insurance uses it when one policy is unpredictable and a large book of policies is not. Finance uses it when one return is noise and a long average is a rate. Quality control uses it when one item can be off and a long run reveals the process. Science uses it when one trial misleads and a long series converges.
The three ideas are one argument. Sampling variability is why two samples disagree. The standard error measures how much their averages should disagree. The law of large numbers says that disagreement shrinks as you take more independent draws. Together they describe an estimate, and they describe how sharp the estimate is. A single small sample does not become the population just because the mean was computed carefully.
Two limits belong next to the formula. The law of large numbers is about averages of independent repetitions. It does not repair a sample that was never random. Survey the same night-shift crew a thousand times and you have a precise estimate of that crew, not of the city. And the standard error describes how the mean moves across samples. It does not describe how far a typical person sits from the average. A tight standard error can sit on top of a very wide population. The city can be full of short sleepers and long sleepers while the average of a large sample barely moves.
The practical habit is simple. When you publish a mean from an extract—sleep hours, a poll, a recovery rate, a claims metric—pair it with the sample size and the standard error, or with an interval built from them. If two samples differ by less than that wobble, the population has not yet shown you a change. Sampling variability is doing what it always does. Name the figure as an estimate. The fluctuation is the price of not measuring everyone.
Sources. Sample variability — an overview. ScienceDirect. https://www.sciencedirect.com/topics/mathematics/sample-variability. Law of large numbers. EBSCO Research Starters (2022). https://www.ebsco.com/research-starters/mathematics/law-large-numbers