Correlation in data analysis and modelling
A practical walkthrough of positive and negative correlation, coefficient strength bands, and three simple scenarios—salary vs experience, car depreciation, and study hours vs scores.
- Data Science
- Statistics
- Modelling
Correlation is the statistical relationship between two variables—how they move together. Ice cream sales rising with temperature is a classic example. That relationship can be positive (both rise together) or negative (one rises while the other falls). Higher employment with lower discretionary spending is one way to think about a negative relationship in everyday terms.
The correlation coefficient summarizes strength on a scale from −1 to 1. In absolute value, roughly: under 0.1 is effectively no correlation; 0.1 to 0.3 is little; 0.3 to 0.5 is medium; 0.5 to 0.7 is high; and 0.7 to 1.0 is very high. Sign tells direction; magnitude tells how tightly the points track a linear pattern.
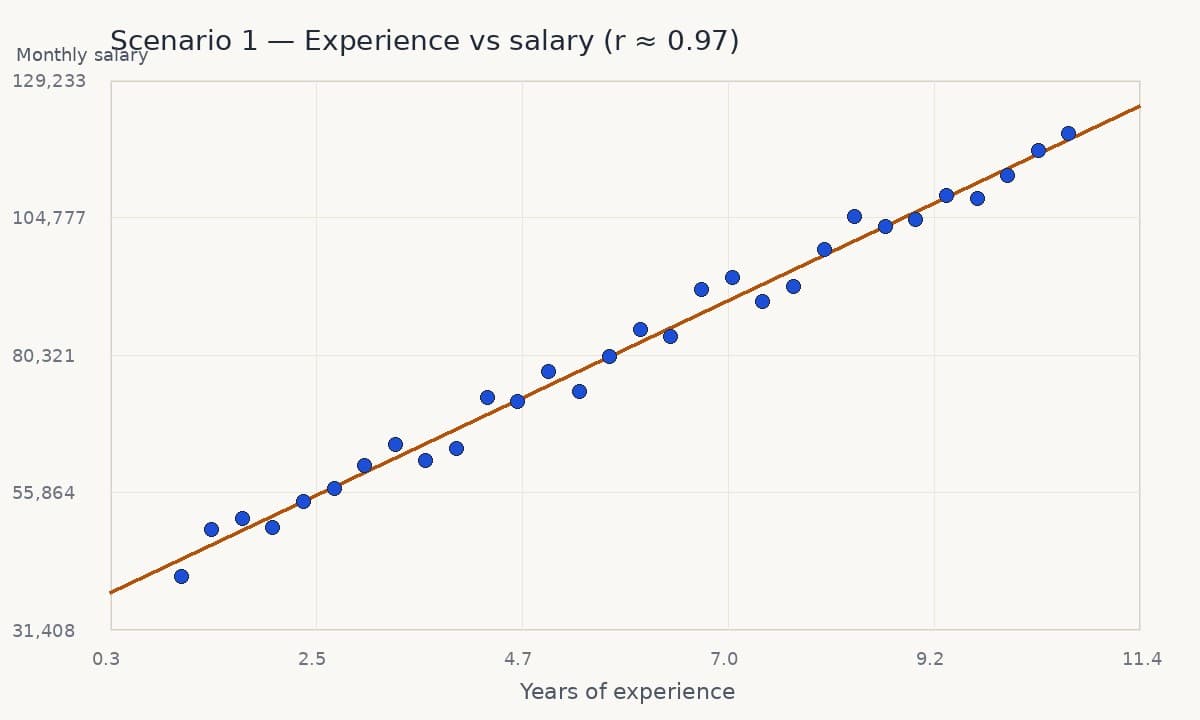
Scenario 1 looks at years of IT experience against monthly salary (in rupees), with savings-account balance as a third series. Experience and salary move almost in lockstep—about 0.97, a very high positive correlation. Experience and account balance are also related, but the strength is weaker. That distinction matters in modelling: a strong linear signal is useful; a weaker one needs more caution before you treat it as predictive.
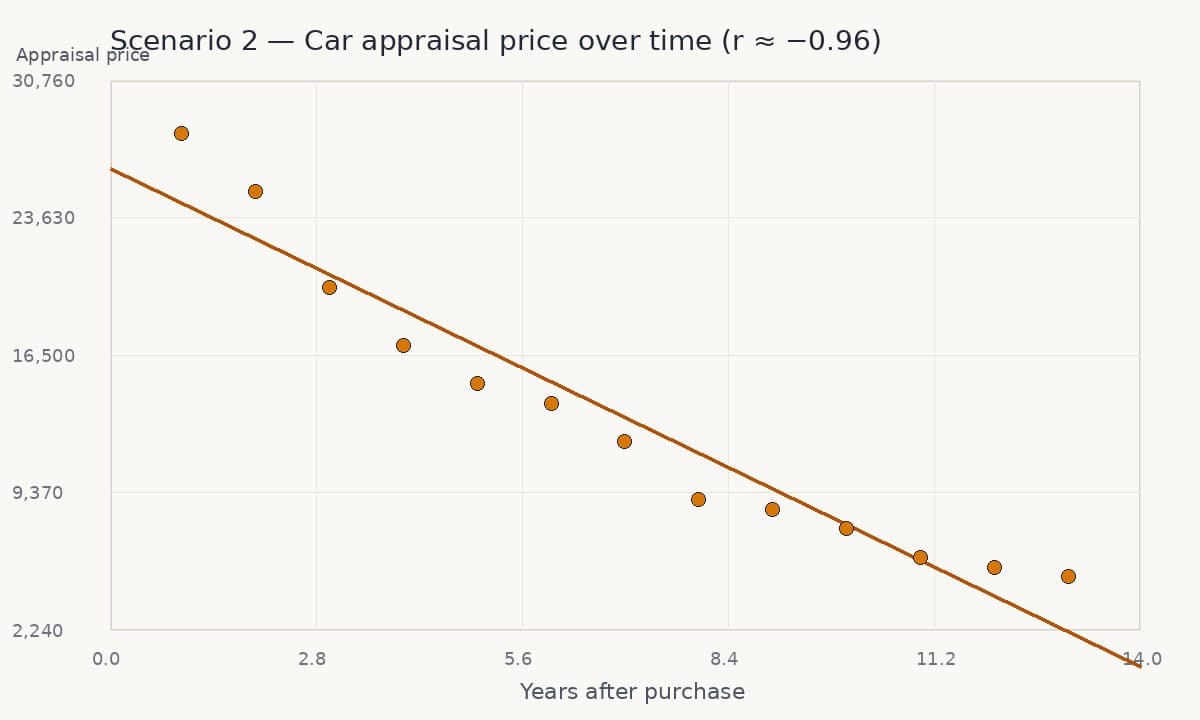
Scenario 2 is car appraisal price over the years after purchase. As the car ages, appraisal price falls. The coefficient is about −0.96: again very high in magnitude, but negative. The older the car, the lower the price. Negative correlation is not “bad data”—it is a clear inverse relationship.
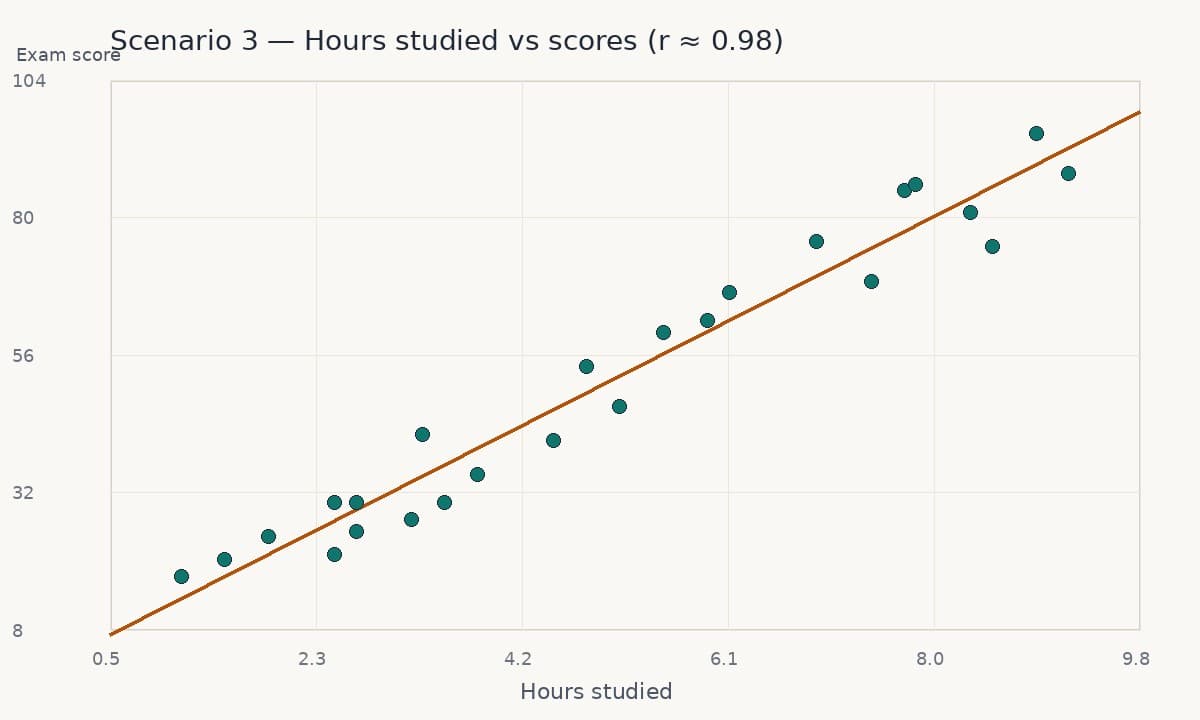
Scenario 3 plots hours studied against exam scores. More study time aligns with higher scores, with a coefficient above 0.9—another very high positive correlation. Across all three examples, the lesson is the same: correlation measures association, not causation, but strong coefficients still tell you which pairs deserve a modeler’s attention first.
This note grew out of coursework for DSC 500 (Introduction to Data Science) in the Master’s in Data Science program at Bellevue University. The scenarios are teaching examples; in production analytics—claims, recovery, or fraud signals—the same discipline applies: inspect direction, strength, and whether the relationship is stable enough to trust.