Problem framing: the question before the model
Part 1 of 10. Translate a business problem into an analytical question, define the target and success metrics, and make the constraints explicit before choosing a model.
- Data Science
- Problem Framing
- Machine Learning
- Lifecycle
This is part 1 of a practical series on the end-to-end data science lifecycle: framing the problem, acquiring and preparing data, exploring patterns, building and validating models, and putting results into use. The methods apply across industries. Examples will draw from different domains—including healthcare—but the focus is on transferable analytical and engineering skills.
A data science effort can fail before the first line of Python when it starts with a tool instead of a decision. Someone says reduce customer churn, detect suspicious transactions, improve a manufacturing yield, or forecast next quarter’s demand. Those are business asks, not yet analytical questions. Translate the request into a decision: who will act on the result, what action could change, and what evidence would make that action worthwhile.
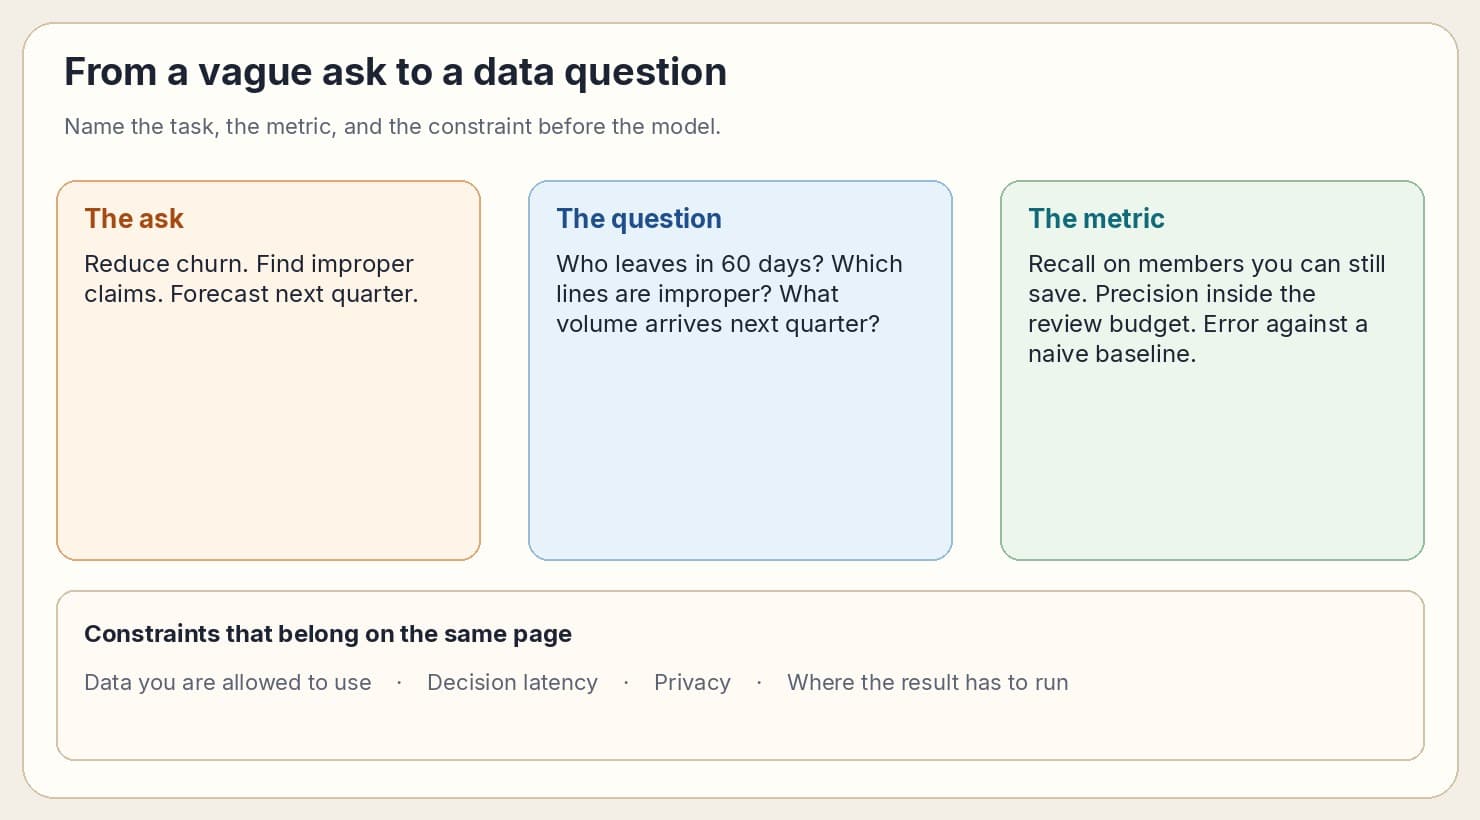
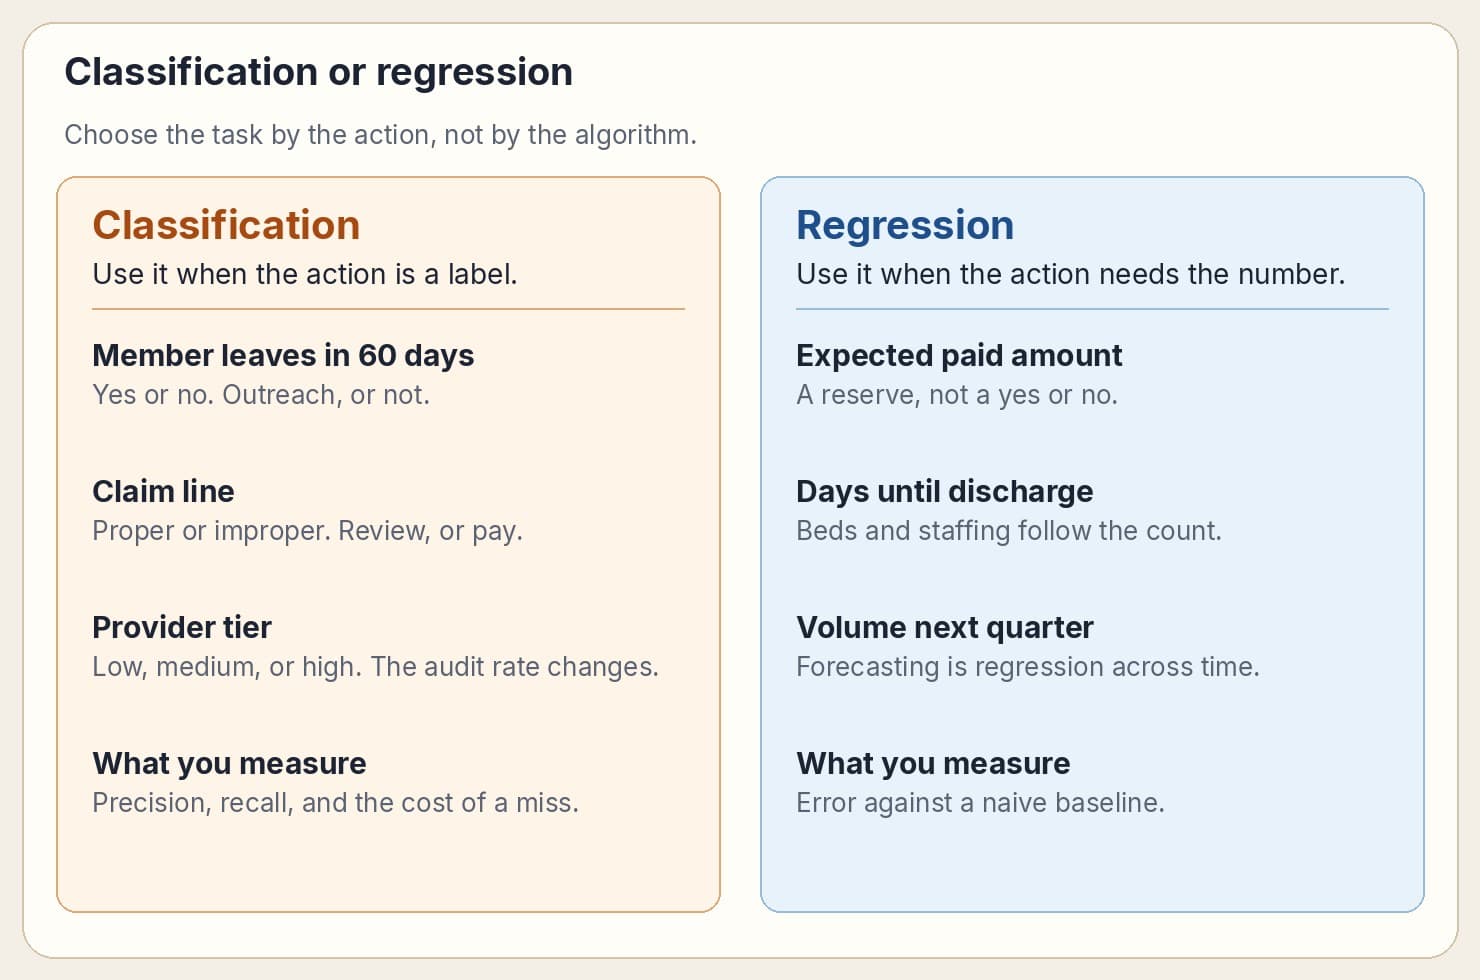
The translation names the task. Classification asks which case belongs in a class. Regression asks for a number. Clustering, which comes later in this series, asks for groups when nobody has labeled the rows yet. Picking the task is not a technical preference. It is a statement of what the business is willing to act on.
Classification is the right task when the decision is a label. A customer may renew or cancel; a transaction may be legitimate or suspicious; a manufactured unit may pass or fail inspection. Healthcare offers another example: a member may or may not need an outreach intervention. Binary and multiclass problems are both classification. What makes the task classification is that the action depends on the predicted category.
Regression is the right task when the decision needs a numeric estimate. Predicting customer lifetime value, delivery time, equipment energy use, or monthly sales volume are examples. Healthcare can provide a familiar case too, such as estimating length of stay or expected cost. Forecasting is regression with time made explicit. If the real decision is only whether a value will cross a threshold, the task may instead be classification; document that threshold during framing.
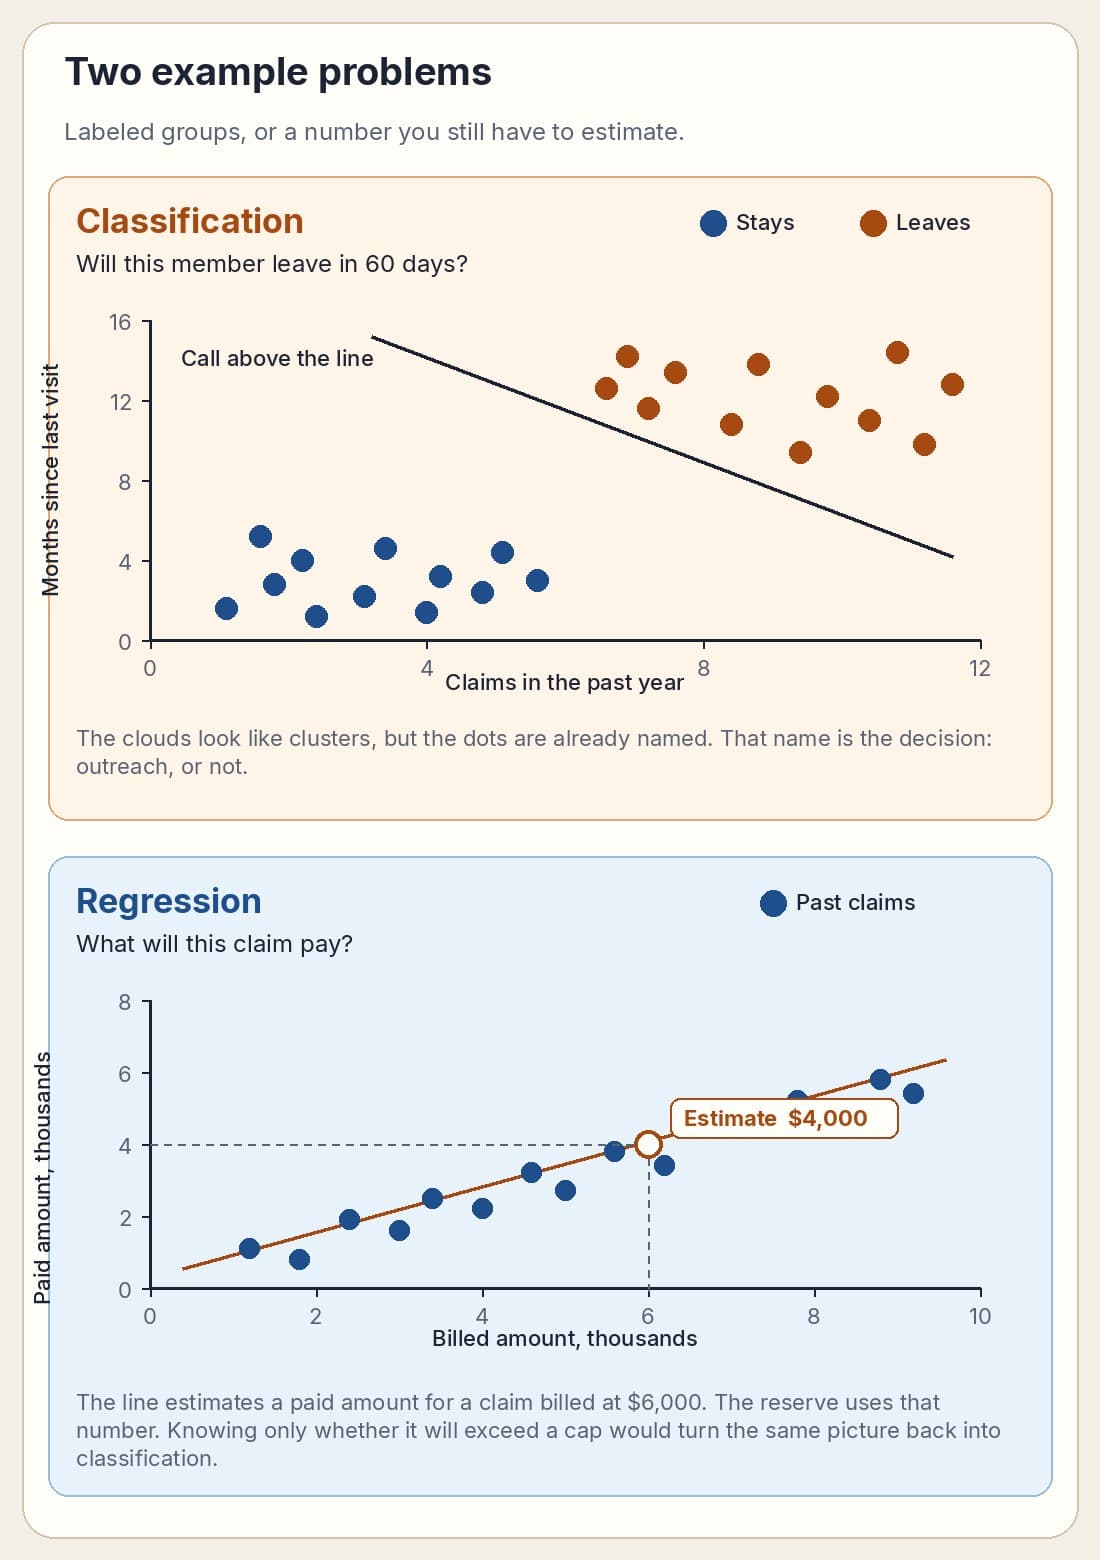
The classification picture might compare customer activity with time since the last purchase, using known renewals and cancellations as labels. The regression picture might compare advertising spend with sales, then estimate sales for a proposed budget. These examples make the distinction visible: classification predicts a category; regression estimates a quantity. The same distinction applies to healthcare, finance, retail, and industrial data.
The metric has to match the cost of being wrong. Accuracy is a poor default when the event is rare: a fraud detector that labels every transaction legitimate may look accurate while missing every fraudulent event. Recall matters when missed cases are costly; precision matters when false alarms trigger expensive reviews. For regression, consider MAE, RMSE, or error against a simple baseline. Ultimately, connect technical metrics to business outcomes such as revenue retained, defects avoided, time saved, or service levels improved.
Constraints belong on that same page, or they arrive later as surprises. Which data are you allowed to use. How fast the decision has to return. What privacy rule covers the row. Whether the result has to run inside a system that already exists, or whether a monthly memo is the whole deployment. A question you cannot answer under those constraints is a different project, not a harder version of this one.
A worked example: predicting customer churn
Suppose a subscription business wants to reduce avoidable cancellations. The first question is not which classifier to train. It is which customers can the retention team realistically contact, early enough to change an outcome, and what counts as a successful intervention? A useful starting definition might be: for each active customer at the end of a calendar week, estimate the probability that the customer will cancel during the following 30 days. The unit of analysis is one customer at one weekly scoring date. This definition makes repeated observations possible while keeping the decision point explicit.
Separate the observation window from the prediction window. For a score generated on 30 June, the observation window might cover the previous 90 days of usage, support contacts, billing events, and product engagement. The prediction window is 1–30 July. The label is whether the customer meets the agreed cancellation definition during that future window. Exclude customers who are not eligible for the retention action, such as accounts already closed at scoring time. Decide how to treat pauses, failed payments, plan changes, and voluntary versus involuntary cancellations before building labels; otherwise different analysts can create different targets from the same source tables.
Write down the intervention as well as the label. If the retention team can contact only 500 customers each week, a ranked list may be more useful than a yes/no prediction for every account. If outreach is expensive, precision among the top 500 may matter. If missing a high-value customer is particularly costly, recall or expected retained value may matter more. A probability score is not itself a business outcome: the team still needs a capacity rule, an offer or action, and a way to measure whether that action changed retention.
Turn the brief into measurable design choices
A compact framing brief for this example could read: decision—prioritize weekly retention outreach; analytical question—which eligible active customers are most likely to cancel in the next 30 days?; unit—customer-week; label—cancellation within the future 30-day horizon; features—only information available by the weekly scoring cutoff; primary evaluation—precision and retained value among the 500 customers the team can contact; baseline—rank by a simple historical cancellation rate or recent engagement rule; constraints—score by Monday morning, respect contact permissions, and do not expose sensitive attributes to the outreach workflow; action—assign the ranked list to the retention team and record contact and outcome.
The baseline matters because it tells you whether a model adds value. Compare the proposed score with a simple rule such as lowest recent engagement or a historical segment-level churn rate. Evaluate both on the same time-based test period and at the same outreach capacity. Do not compare a model's top 500 with a baseline that was allowed to contact 5,000. Report precision at 500, lift over the baseline, the number of customers retained, and the cost of outreach. Where possible, use a controlled experiment to estimate incremental retention; a predictive model alone cannot prove that contacting a high-risk customer caused that customer to stay.
Protect the prediction timestamp
Feature availability is a timestamp question. A support ticket opened after the weekly score, a cancellation reason entered after closure, or a final invoice generated at month-end cannot be used to predict churn at the start of that month. Build the training table as it would have appeared at each historical scoring date, not from today's fully updated customer record. Split training and evaluation by time so future behavior cannot leak backward. If customers appear in multiple weekly snapshots, also check whether your validation design matches the real deployment and avoids accidental overlap that makes the test unrealistically easy.
Create a short problem-framing brief before data exploration: business decision; analytical question; unit of analysis and eligible population; target variable and prediction horizon; available-at-decision-time features; success metric and baseline; operational constraints; and the action that follows the result. Check for target leakage: a feature must not contain information that would only become available after the prediction is made. This brief becomes the contract between the business question and the technical work. Part 2 moves into source discovery and reliable data ingestion.