Python vs R: when each wins in production vs analysis
Both are open-source staples for data work—but they pull in different directions. Here’s a practical way to choose for production systems versus statistical analysis.
- Data Science
- Python
- R
If you work with data long enough, the Python-versus-R debate stops being religious and starts being operational. Both languages are open-source and platform-independent. Both have serious communities around analytics, machine learning, and AI. The useful question is not which is “better.” It is which one reduces friction for the job in front of you.
Python is a general-purpose language that happens to be excellent at data. The same runtime can power a web service, an orchestration job, a feature pipeline, and a model scoring endpoint. That breadth is why it shows up so often in production engineering: teams already ship Python beside cloud APIs, containers, and CI. R’s center of gravity is different. It grew up around statistical analysis and representation. Packages, formulas, and plotting idioms are designed so exploratory work moves quickly from question to evidence.
Popularity indexes usually place Python near the top and R much further down. That gap matters less as a scoreboard and more as a hiring and ecosystem signal: more production tooling, tutorials, and platform integrations assume Python first. IDE choice follows the same pattern. Python developers commonly land in VS Code, PyCharm, or Spyder. R work still concentrates in RStudio, with alternatives like RKWard or R Commander for specific workflows.
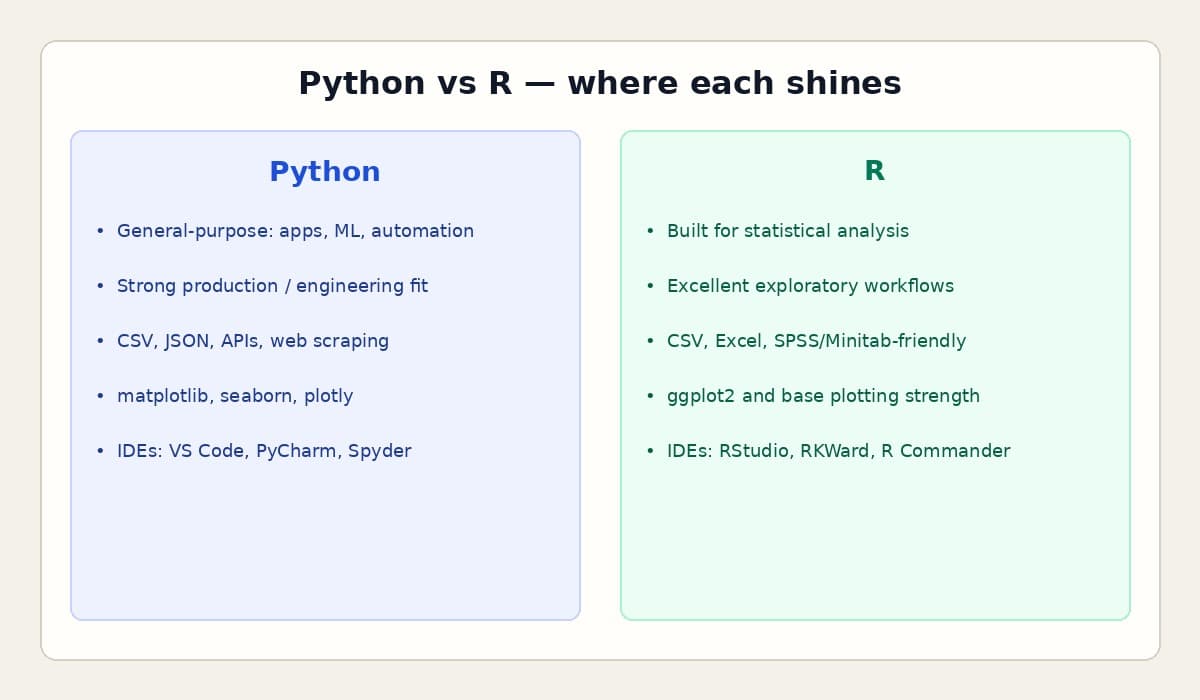
Data access patterns reinforce the split. Python is unusually flexible about sources—CSV, JSON, REST APIs, and web scraping often live in one workflow. R handles Excel, text, and CSV cleanly, supports light scraping well enough for many analyses, and can pull research formats such as SPSS or Minitab into data frames without ceremony. If your day starts by negotiating half a dozen modern API payloads, Python usually hurts less. If your day starts in a statistics-heavy spreadsheet world, R feels native.
Visualization is where R still surprises people who only know Python. Basic charts and plots are quick in base R, and ggplot2 remains one of the clearest grammar-of-graphics toolkits available. Python can produce excellent visuals with matplotlib, seaborn, or plotly—especially for interactive dashboards—but visualization is rarely Python’s first advantage. In analysis reviews, R often gets you to a persuasive figure faster. In product UIs and scheduled reporting services, Python usually integrates more cleanly.
Production is the tie-breaker for many architecture decisions. When a notebook must become a scheduled job, an authenticated API, or a package consumed by other services, Python’s packaging, typing ecosystem, and deployment footprint are hard to ignore. R can absolutely run in production—and many organizations do it well—but the default path from prototype to hardened service is shorter in Python for most engineering teams.
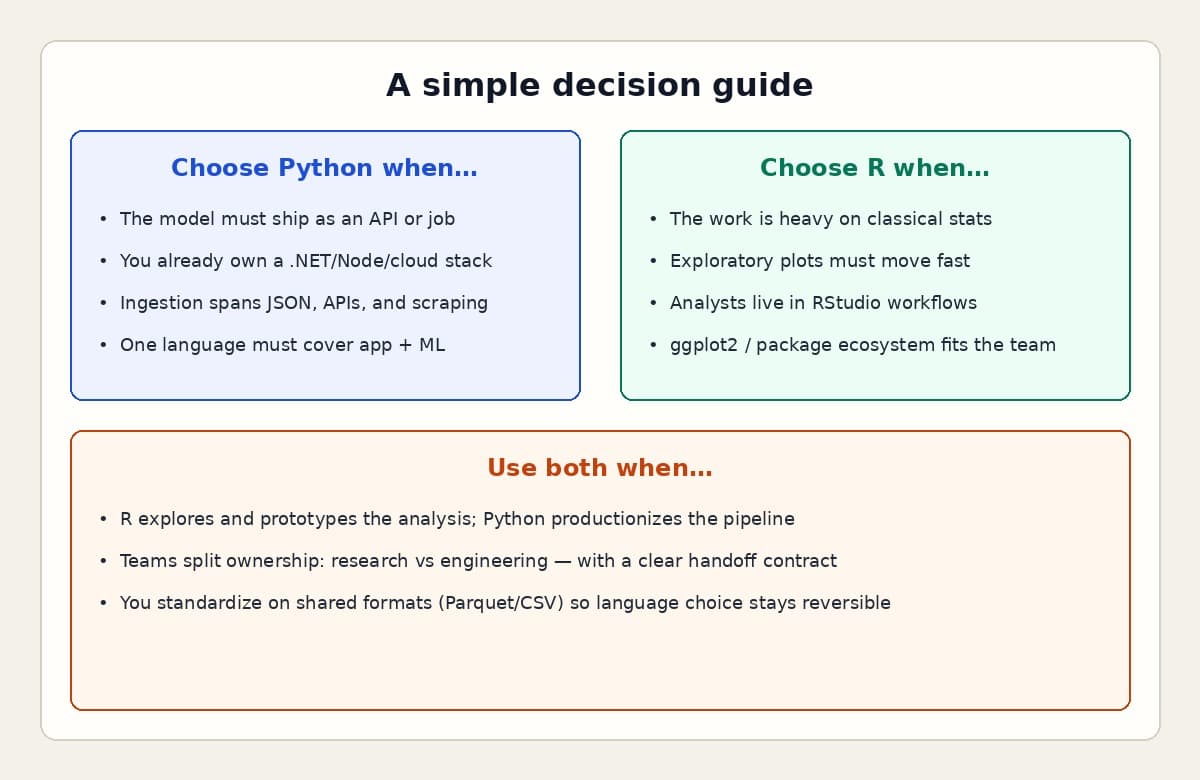
A practical rule set: choose Python when the artifact must run unattended in a production path, when the surrounding stack is already Python-friendly, or when one language must cover application code and ML. Choose R when the bottleneck is statistical modeling, experimental design, or rapid exploratory graphics, and when the consumers of the work are analysts who live in that environment. Use both when R is the best thinking environment and Python is the best shipping environment—as long as you define the handoff. Shared on-disk formats (Parquet or well-typed CSV), explicit schemas, and clear ownership prevent the dual-language setup from becoming dual truth.
In healthcare and claims systems work, that pattern shows up often: exploratory recovery or anomaly analysis may start where statistical tooling is strongest, then move into Python or .NET services once the rule, score, or feature must execute on a clock. The language decision is really a boundary decision—where exploration ends and operations begin.